
As the state report cards begin rolling out soon, I think it’s important to look beyond their byzantine1 calculations and examine the bottom line: how much do traditional public school graduates make vs. how much do Charter School graduates make?
I mean, that’s what this is all about, isn’t it? Who cares how you scored on a test in 10th grade if 5 years later you’re making 20% less income, right?
Well, in Ohio, charter school graduates have left between $247 million and $321 million on the table … just since 2018. Over the course of their lifetimes? Try $1.8 billion to $6.7 billion2.
That’s right. Charter schools cost their graduates billions of dollars in lost income over their lifetimes. Which makes sense, I suppose, given how much these things have cost taxpayers over our lifetimes.
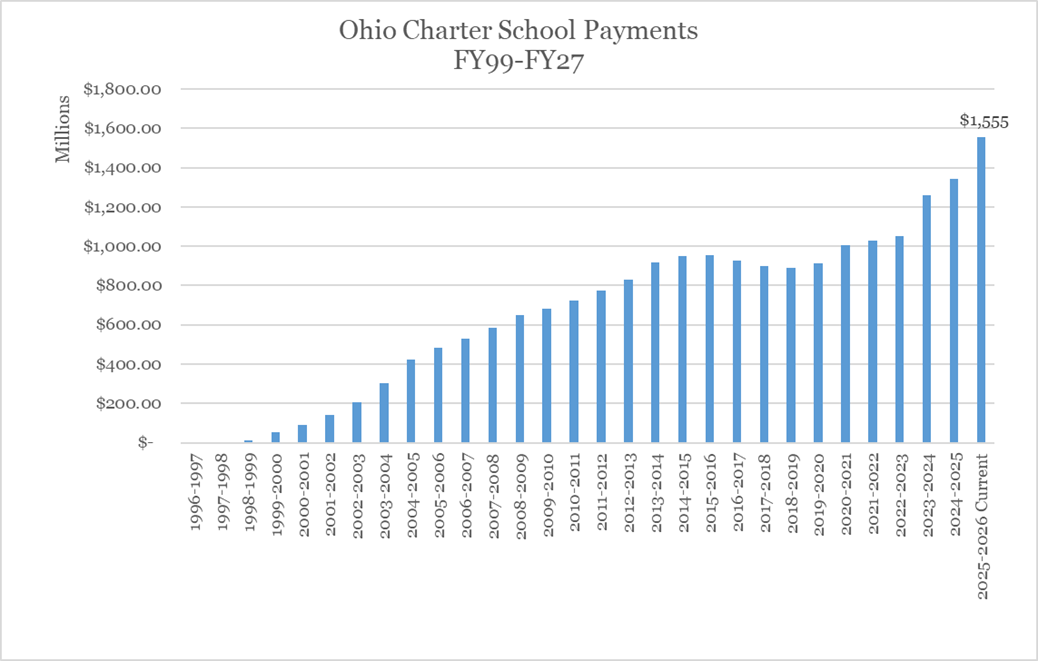
Here’s some amazing tidbits as well from this newly released data:
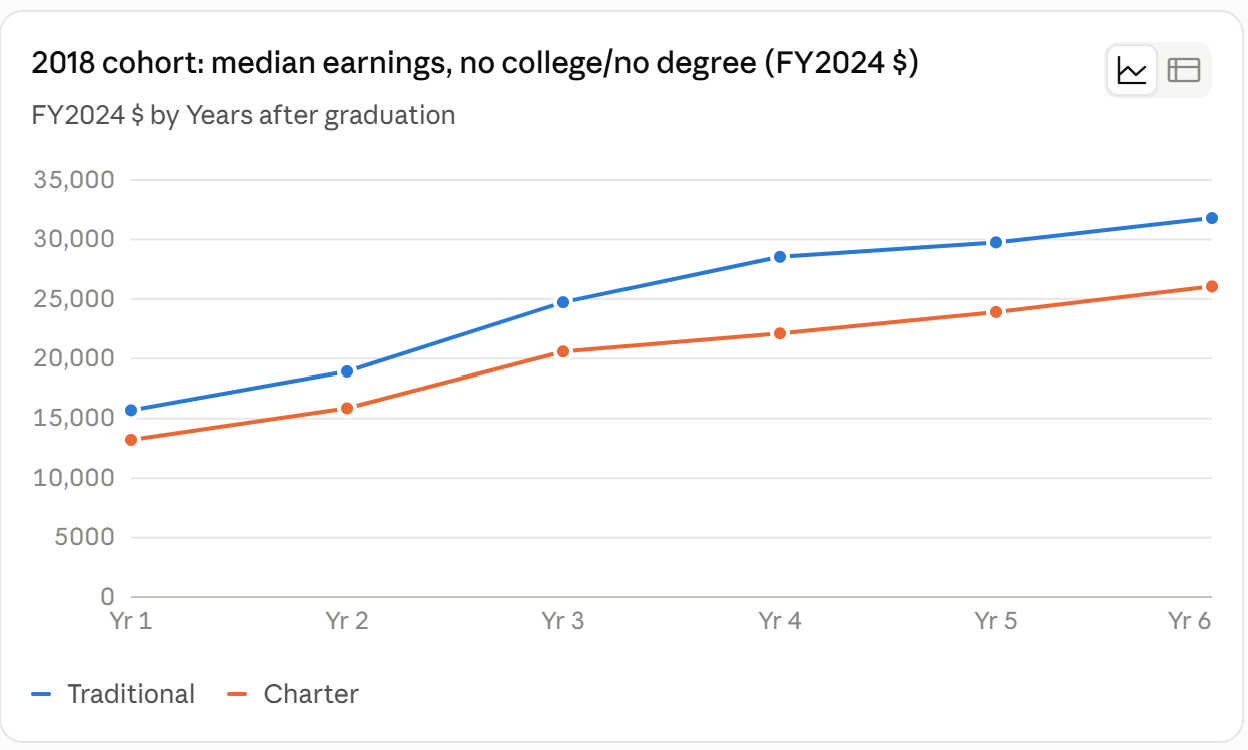
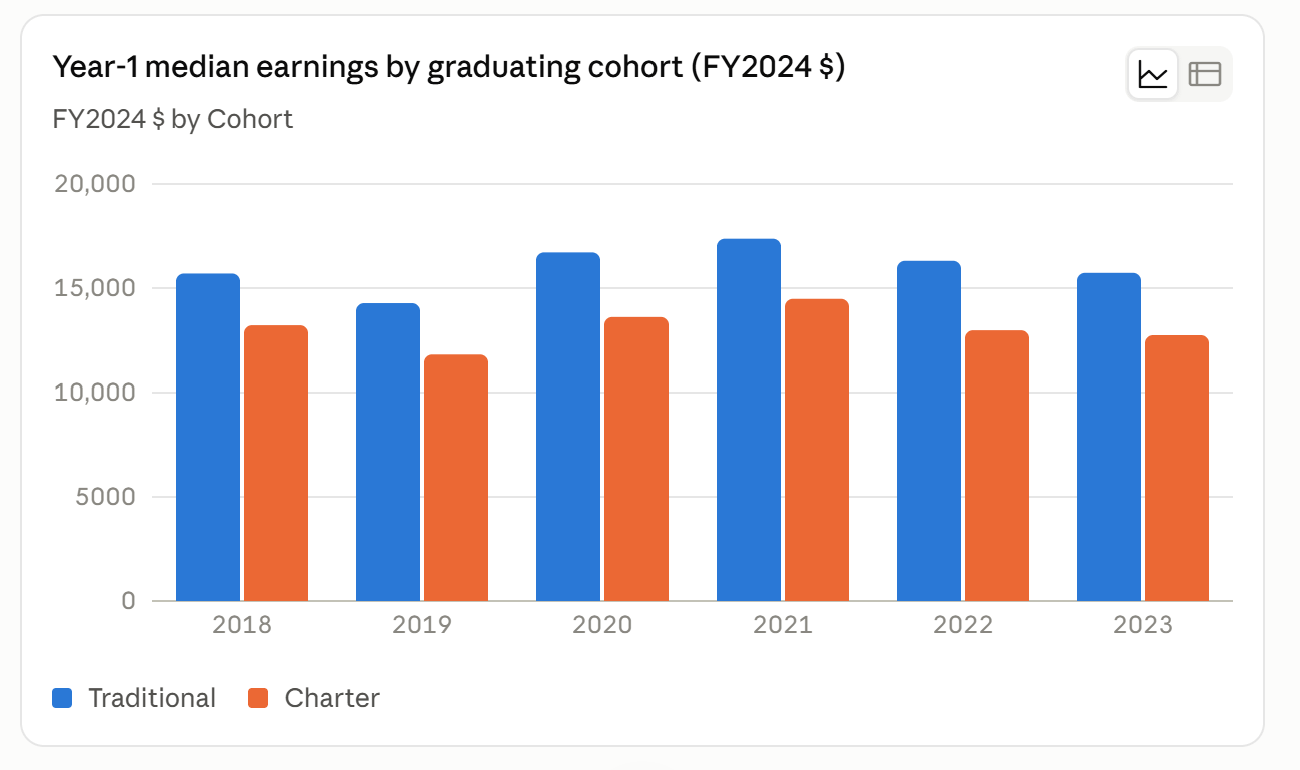
Charter school graduates never outearn their traditional school counterparts. Every year, they earn less.
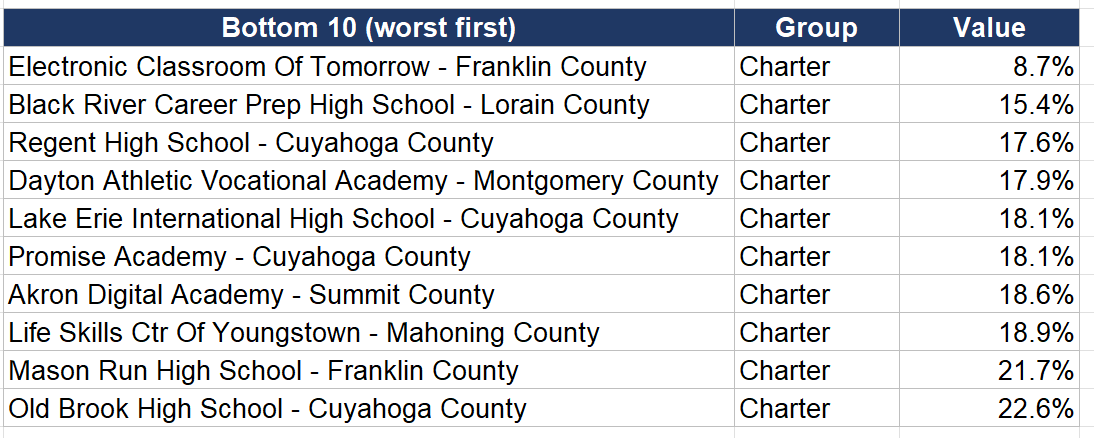
The 10 worst graduation rates are all charters, headed up by (of course) the Electronic Classroom of Tomorrow (now defunct because it stole more than $120 million of our money)
Just as a friendly reminder, Sen. Jon Husted is the only honorary degree recipient from the school. Might be something ot keep in mind this fall.

So, let’s take an inventory of the state of Ohio’s $1.6 billion annual charter school regime Husted created, shall we?
More than 1 in 3 are on the state’s lowest-performing building list.
More than 9 in 10 “Dropout Recovery” charters are on the list.
About 1 in 5 charters have been on the list since 2018.
More than 1 in 2 charter schools that have ever opened in Ohio are now closed.
They received more than 1/2 of all F grades ever given to schools on Ohio’s Report Card, despite representing about 10% of all Ohio school buildings.
They spend almost double the share of their funding on non-instructional administrators that Ohio’s traditional public schools spend.
They receive more than double the state funding that a traditional Ohio public school student receives.
They spend more, on average, per pupil than a traditional Ohio Public School District, even though charters can’t collect local revenue (except for a handful in Cleveland).
They produced the single largest taxpayer ripoff scam in Ohio history, largely enabled by Sen. Jon Husted, and are constantly being busted for fraud and other corrupt practices.
Charter School students are about 7 percent of the state’s school population, but receive 12 percent of the state’s funding for schools.
That funding (along with EdChoice vouchers) is preventing the state from fully funding its own formula to provide resources to the state’s 1.5 million traditional public school students.
More than 1 in 10 Ohio charter schools are on the state’s suspected test cheating list and 7 out of every 10 schools suspected of cheating on their state tests are charter schools.
More than 1 in 4 of the state’s “high performing” charter schools are on the state’s suspected test cheating list.
They have cost charter school graduates between $247 million and $321 million since 2018 and will cost them between $1.8 billion and $6.7 billion over their collective lifetimes.
Is this enough to inspire the legislature and Governor to finally do their jobs and deeply scale back the $1.6 billion we spend annually on these things?
I mean, that would go a long way toward fully funding Ohio’s formula to pay for the needs of the 85 percent of students attending Ohio’s traditional public schools, wouldn’t it?
Wouldn’t they rather invest in the schools whose graduates make hundreds of thousands of dollars more over their lifetime than charter school graduates?
Yeah. I don’t know about you, but for me?
It.
Is.
Time.
As a fan of the Byzantine Empire, I don’t like this pejorative, but I’m limited to English here.
I admit I had help from by friend Claude on this statistical analysis. Here’s what I had him do. Look at the new High School Outcomes spreadsheet the Ohio Department of Education just put out here: https://education.ohio.gov/getattachment/Topics/Ohio-s-Graduation-Requirements/Ohio-High-School-Outcomes/OHSO_Main_DataDownload.xlsx.aspx?lang=en-US. Then I had him look at the median salary for each graduation cohort since 2018 in each subsequent year to their graduation. I excluded students who earned post-secondary degrees so that we wouldn’t mix in post-secondary education’s impact on lifetime earnings. This is just based on graduates who have zero degrees. So as close as possible to isolating the impact of each school type on future earnings.
Claude then subtracted the median salaries earned by traditional public school graduates and charter school graduates, then weighted the results based on the number of graduates from each school. Then I had him multiply the number of graduates by that per student difference in each cohort year, then add them up. The post-2018 range is based on whether you use the median (low end) or mean (high end) differences. The lifetime extrapolation is based on national earning patterns, according to the U.S. Census bureau, through age 65. The extrapolation assumes no one works past their age 65 year. The earnings range is based on whether the charter school money gap closes over time (low end) or whether the charter school graduate share of earnings holds over the course of their lifetimes (high end).