Private school where administrators drive Mustangs performs far worse than it should, Public schools do better
This is what accountability looks like. Imagine if these schools actually had real report cards like public schools?

This post is going to be a little wonky. And for that, I apologize in advance. But I’m trying to make a point here: Private schools want zero part of this kind of performance-based scrutiny — the same kind that has dogged public schools for more than 30 years.
Which is why I’ve always said that if the robed politicians on the Ohio Supreme Court decide to ignore the Constitution and keep the unconstitutional EdChoice private school tuition subsidy in place, the best way to minimize its effect on public school students is to require accountability for private schools.
Because they want zero.
Always have.
It’s why they’ve never been audited. Or why they get to pick the tests their students take. Though it is interesting that, despite the fact that no students getting publicly subsidized tuition were tested before I inserted the testing provision into House Bill 1 in 2009, the provision requiring subsidized students get tested remains in law — perhaps the last remnant of the historic, and national award-winning bill (informally bearing my name1) that was the original fix to Ohio’s unconstitutional school funding system.
Here’s the problem, though. There aren’t report cards outlining how private school students are faring on these tests the way there are on public school students, even though now at the Immaculate Heart of Mary School in Cuyahoga Falls, the public fully pays for their students’ tuitions in many cases.
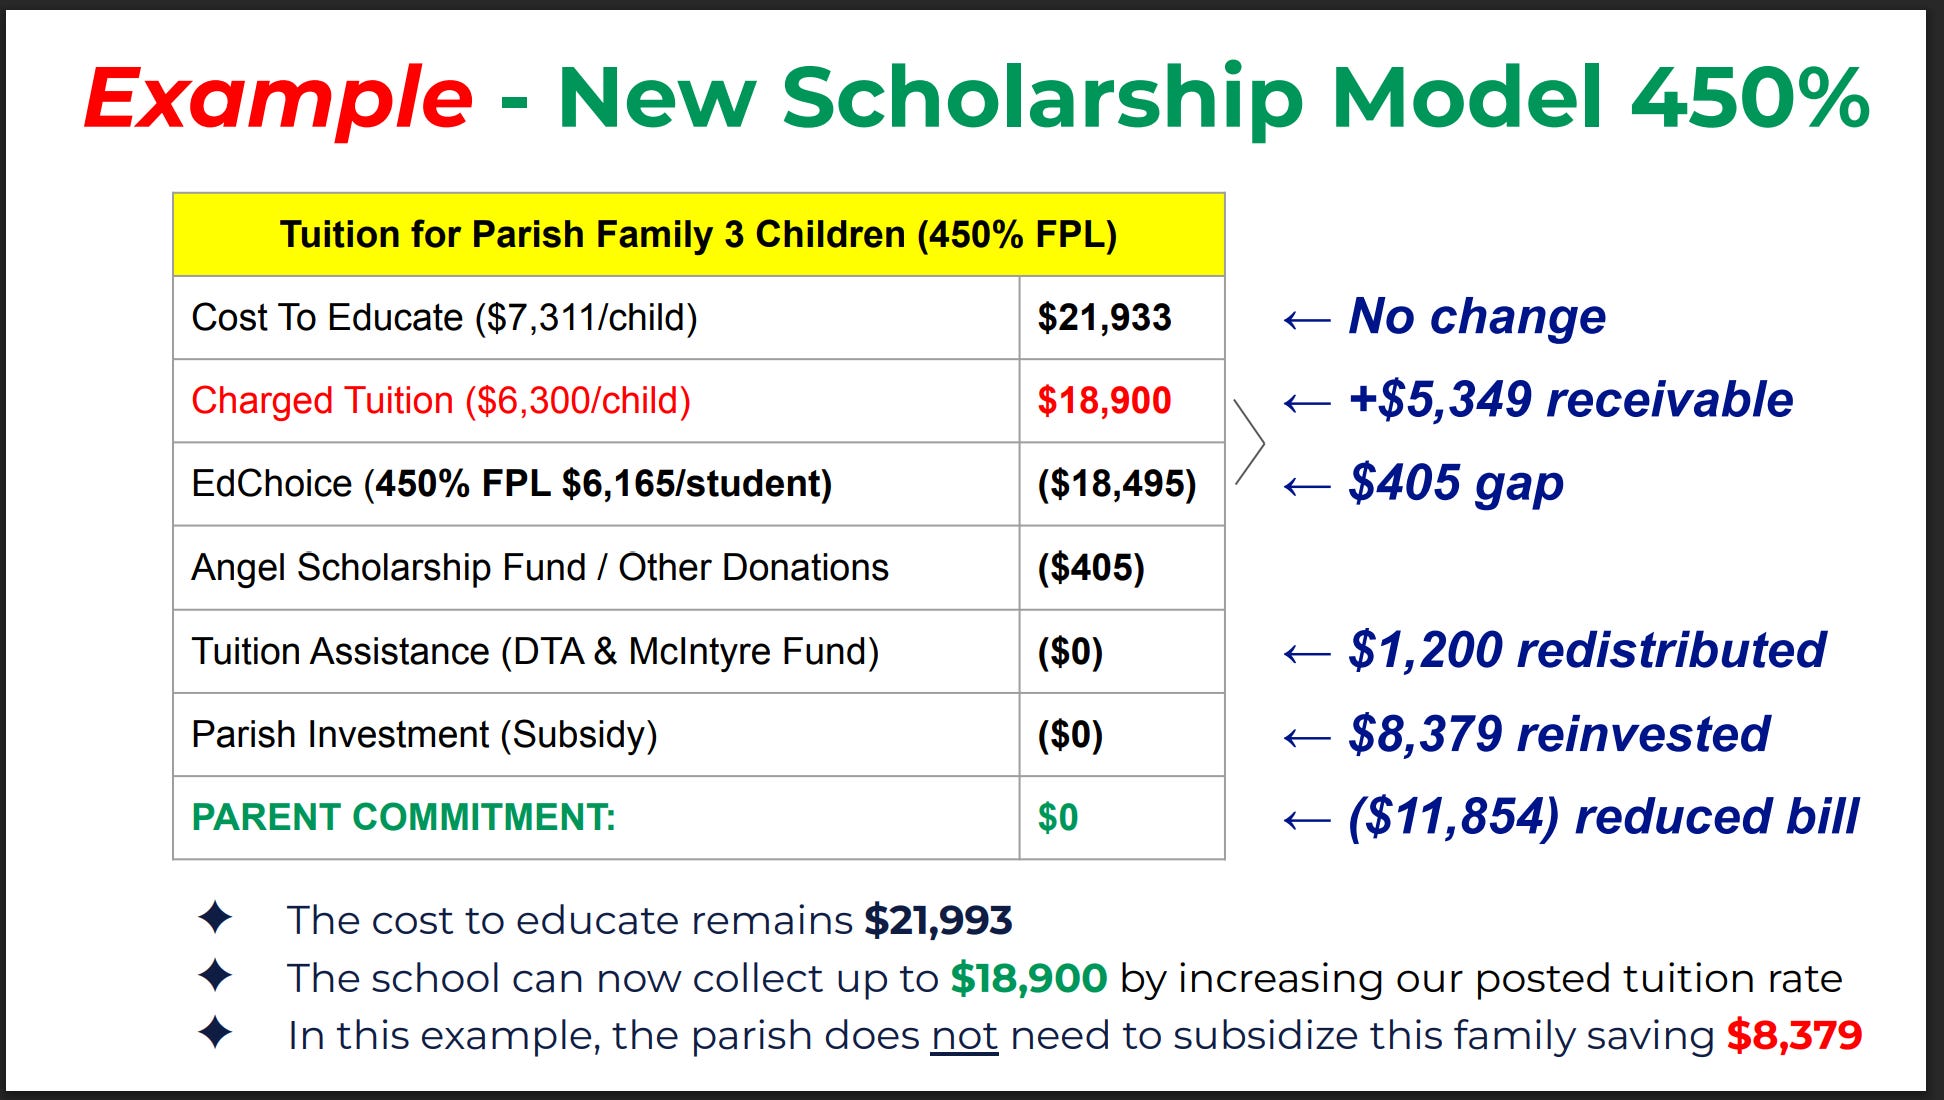
IHMS is becoming a poster child of sorts for all that’s wrong with Ohio’s taxpayer tuition subsidy program, what with their principal and pastor both bragging on social media about their awesome Mustangs while they’re admitting that taxpayer subsidies are allowing them to re-direct Parish resources to wealthier students and away from poorer ones.
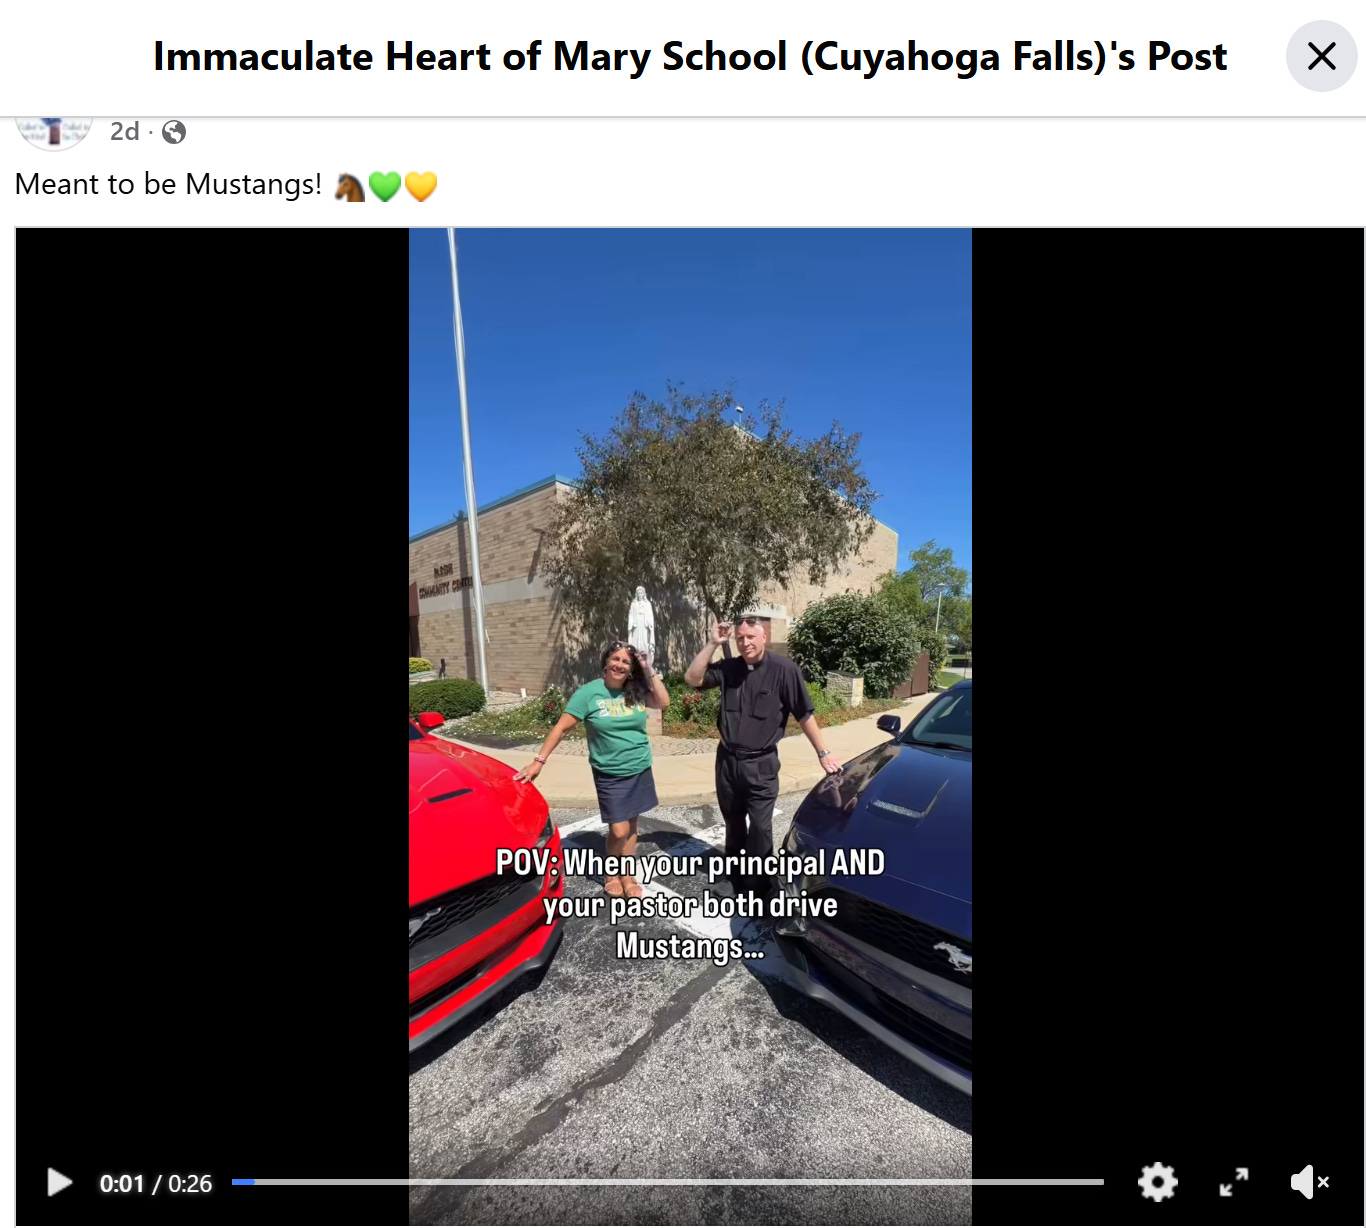
We know they’re good at car shopping, especially as taxpayers are forced to unconstitutionally subsidize their school to the tune of $1.5 million a year.
But how do those students actually perform?
First of all, I want to be clear that it is really difficult to do apples-to-apples comparisons on state tests administered to Ohio’s public school students and students receiving unconstitutional tuition subsidies.
What we can do, though, is see how each sector performs on their tests and whether they are over or underperforming their school’s demographic makeup. So it’s not looking at what percentage of students in each school are testing proficient or better. It’s whether those students’ scores are outperforming their demographic makeup. For as we have known for years, standardized test scores are dictated as much by their takers’ wealth as their takers’ learning.
First of all, let’s look at Cuyahoga Falls City Schools’ performance. Again, they’re taking the rigorous state tests.
Here’s what we see in their scores and their change between the 23-24 school year and 24-25 school year (the only two years that we can compare with IHMS because those are the only two years of testing we have on IHMS):
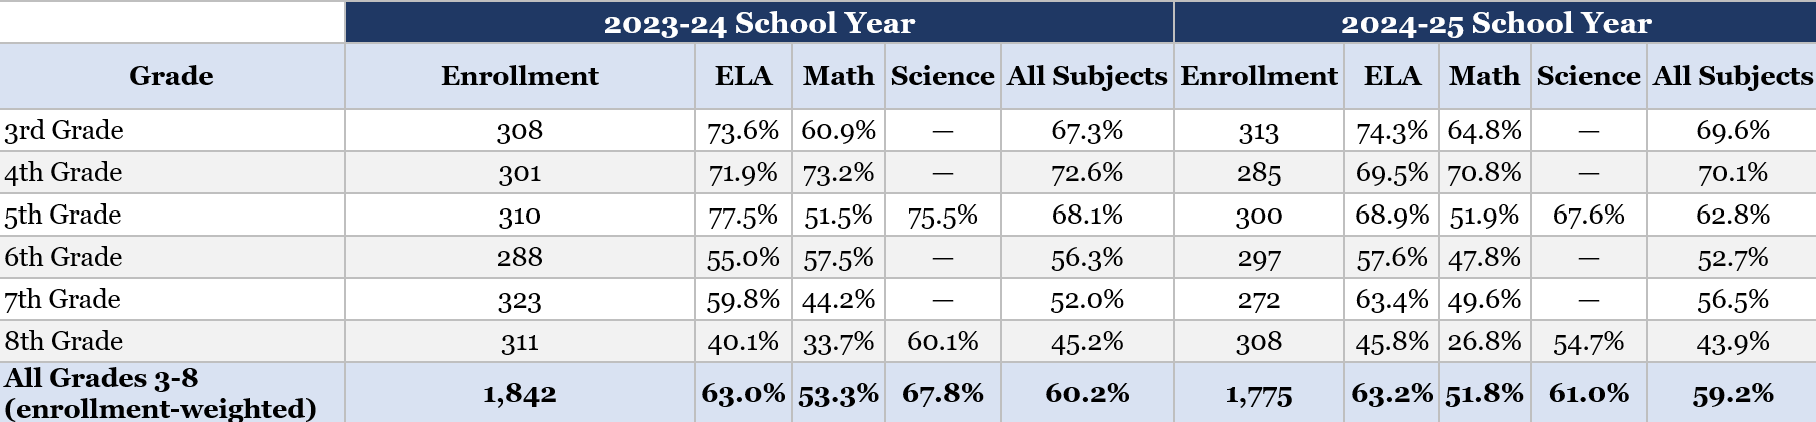
Looks like you’re looking at some drops in performance among the grades, right? So bad news for Cuyahoga Falls?
But now, let’s take a look at Cuyahoga Falls’ demographic makeup.
In 2023-2024, 54.5 percent of CFCS’s students were economically disadvantaged. In 2024-2025, 63.6 percent were. While that jump is largely attributable to a change in the way that economically disadvantaged students are counted. However, it is fair to assume that 50 percent of the demographic change was due to real poverty change, not just accounting.
So what does that do to CFCS’s performance2? It boosts the percentage score increase by 1.4 percent, which means that the following occurs:
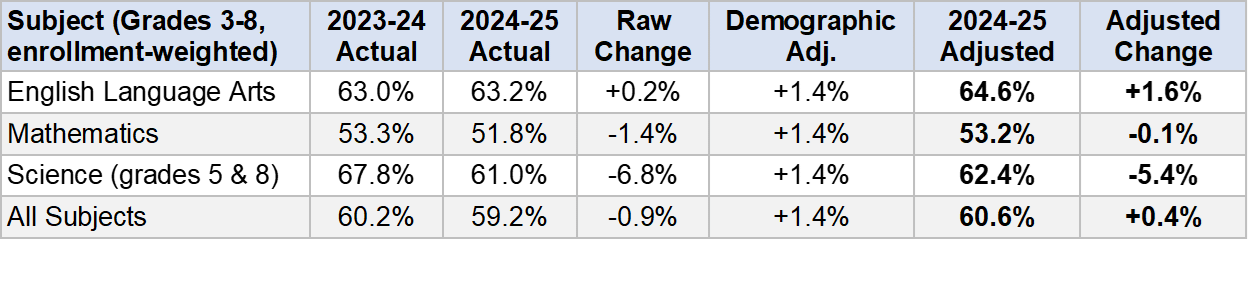
In other words, the drop in performance from 2023-2024 to 2024-2025 in the Falls can be attributed almost entirely to the demographic shift. As poverty goes up, performance should go down. In the Falls, though, performance actually did go up, despite poverty increasing in the district3.
Let’s look at IMHS now, shall we?
First, their demographic change:

As you can see, the opposite happened in IMHS. There are only 15 of 282 EdChoice students that are low-income qualified now. In the 2023-2024 school year, there were 51. That’s a huge shift away from low income students. Which means we should see a corresponding test score improvement, right?
Welp, not exactly.

Instead, there were significant test score drops at IMHS, despite that significant increase in percentage of EdChoice students who were not classified as low income.
Applying the same weighting to IMHS that was applied to CFCS indicates an even worse outcome for IMHS — an adjusted drop of 3.1 percent.
So what’s the bottom line on the performance?
Cuyahoga Falls City Schools saw an increase in Economically Disadvantaged students and still improved their test scores when adjusting for that, or at least outperformed expectations. Meanwhile, IMHS saw an increase in wealthier students, yet saw a significant performance drop among their EdChoice students’ scores.
At the end of the day, here’s what we know about IMHS:
Starting in 2023-2024, they’re received about $1.5 million a year from taxpayers through the unconstitutional EdChoice tuition subsidy program — an amount so large that nearly all their students’ tuitions are completely paid for by taxpayers.
Their top administrators drive newer Mustangs.
Their parish resources have shifted from predominantly helping the school’s poorer students to exclusively helping the school’s wealthier ones.
Their EdChoice students’ performance has gotten worse since they’ve started getting the unconstitutional EdChoice tuition subsidies, despite their student population getting wealthier.
We have no idea how much of the $400,000-$800,000 of Parish and Cleveland Diocese money the school says EdChoice has freed up goes to students versus overhead (or Mustangs), though judging by the students’ performance drop, I’m guessing it didn’t go to help kids much.
We have no idea how this school spends its money. And that’s by design.
There are more private schools getting at least 70 percent of their students on unconstitutional EdChoice tuition subsidies than there are public school districts. So you know this is going on throughout the state.
What started a week ago as a look into a private school’s social media post about Mustang-driving administrators has really exposed the seamy underbelly of Ohio’s unconstitutional EdChoice private school tuition subsidy program.
What’s more chilling to me is that this is just one of more than 612 private schools in this state where this stuff is happening.
Will state leaders do anything about this unconstitutional waste of taxpayer dollars that has forced all of us to raise our property taxes so much we’re seriously considering getting rid of property taxes?
Not without all of us forcing them to. Remember what my journalism mentor always told me: If they’re getting away with it, it’s your fault.
So let’s do something about this. Seems like we have an election coming up in a few months. Maybe that’s the time.
Yeah. That’s the perfect time.
From the story: “Dyer is chairman of the House Finance subcommittee on primary and secondary education funding, and more importantly, he is the architect of the revised Strickland plan. So much so that around the Statehouse these days the new funding formula is referred to as the Dyer plan.”
Here’s the methodology, if you want to know (I picked how to do it, Fable 5 wrote the formulas): I calculated the overall proficiency as Economically Disadvantaged share × Economically Disadvantaged proficiency + (1 − Economically Disadvantaged share) × non-Economically Disadvantaged proficiency. Holding proficiency constant shows that a rise in Economically Disadvantaged share mechanically lowers the overall rate by using the following formula: (change in ED share) × (Economically Disadvantaged/non-Economically Disadvantaged gap).
For anyone who doesn’t like me picking 50% as the midpoint for what percentage of the change in poverty could be attributable to real poverty change, I had Claude look at the effect on overall proficiency depending on what percentage of the change can be attributed to real poverty change vs. accounting:
